In this post we learn about a circuit design which can be used for testing, or analyzing plant physiological behaviors and reactions to various external stimulation.
That trees and plants have a soul has been known to plant lovers and gardeners for a long time. For all those who have never given this a thought and who have never done more to plants than water them, we give here a circuit which will make it possible to get into closer contact with those oft-forgotten members of his or her ‘family’.
Many will dismiss this experiment as belonging to the realms of parapsychology, but it has already been possible to measure a non-periodic signal between 1 and 40 Hz with an amplitude which varied between 0 and a few microvolts. These signals can without any doubt be traced back to plant activities.
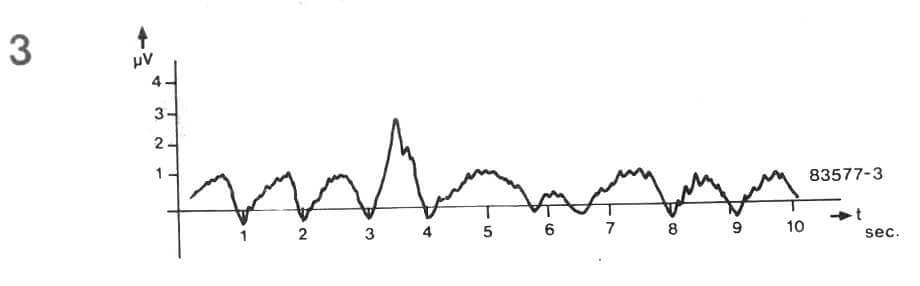
The oscilloscope traces are often not directly connected with manipulation of plants. Particularly at the beginning of a series of experiments, a violent reaction could be observed in the plant before the traces shown in figure 3 could be made.
Whatever caused the traces, it is certain that in order to understand plant behavior and make further measurements, an amplifier with a high degree of amplification and noise suppression is necessary. The input circuits (see figure 1) are therefore high-input-impedance amplifiers, A1 and A2; the input impedance is 1 M (R1 and R2).
The signal is subsequently applied to a differential amplifier, A3, which has an amplification factor of about 10.. The amplification of the input amplifiers has therefore been kept low, so that A3 can not be driven to saturation. Mains-hum and high frequencies are filtered from the output of A3 and this is done by means of active low-pass filter A4, the cut-off frequency of which is about 50 Hz.
A passive high-pass filter (C3, R13) then removes any DC components which have not been filtered by A4; the cut-off frequency of this filter is about 1 Hz. Subsequently, the signal is fed to a non-inverting amplifier, A5, of which the amplification factor is about 1000.
Because of the high input impedance of A5, it does not have much effect on the high-pass filter. As each amplifier stage reintroduces noise and mains hum onto the signal, these must again be filtered in a lowpass and a high-pass filter. It would be possible, with a suitable oscilloscope, to make measurements across R19, were it not for the fact that we want to connect a recorder or VCO or something similar and the signal will therefore have to undergo further amplification. This is effected by A7.
The total amplification of the circuit can be adjusted by means of potentiometer P1 between 85 dB and 120 dB. At maximum amplification, the '1 V per scale division’ range of the oscilloscope will measure 1 microvolt.
To prevent mains interference in this highly sensitive amplifier, the supply is provided by two batteries. And to really be able to make full use of the sensitivity, mains interference should also be filtered from the oscilloscope or recorder or VCO mains supply.
This could be done with an opto-coupler but an LED and LDR in a light-proof box will do nicely. The absorption circuit of the LDR could be supplied from a mains power unit, but here again a battery would be preferable to prevent interference finding its way to the amplifier. If you want to obtain measurements which can be used as proof, a series of measurements will have to be made over a period of time (including when you're not home). This cannot, unfortunately, be done by just an oscilloscope, but by a data recorder.
This is, however, a very expensive piece of equipment and can be substituted by a VCO of which the signals are recorded on tape. And now for the method of measurement. The first that's needed is a signal detector and the simplest is a set of gold-plated pins from an IC socket.
Better are small sensor plates which have been lightly covered with conductive paste before they are attached to the plant. Three pins or sensors are required: the central one must be connected to the screen of the connecting cable; the other two go to inputs A and B. lt is important that both these conductors are separately screened, the screen being connected to earth at the amplifier end. The detectors should be attached to branch or plant stem not more than 2 . . .3 cm from one another (figure 2).
The plant physiologyy analyzer recording equipment must be earthed at the mains input. it also advisable to build the amplifier into the smallest possible case; an earthed metal one is not absolutely necessary, but it cannot do any harm. With properly functioning equipment, the output signal should resemble the traces shown in figure 3: these give the required information as to the voltage variations occurring in plants and trees.
The resolution in case of a data recorder should, of course, be such that a readable trace is produced: paper feed speeds of 0.5.. . 1 cm per second are ideal,- but in order to keep paper costs down, it is advisable to use lower speeds. Finally, we would be most interested in hearing from readers about their researches into plant physiology.