In this article I am going to take you through a detailed discussion about how to design notch filters with precise center frequencies for maximum impact.
Where we can Use Notch Filters
We often find that notch filter circuits are incredibly useful for suppressing nullifying or canceling specific ranges of frequencies. This is particularly important when we want to avoid annoying or unwanted interference within a circuit configuration.
Notch filters become especially handy in sensitive audio equipment like amplifiers and radio receivers where we need to eliminate a single or a select number of unwanted interfering frequencies using a straightforward approach.
Back in the earlier decades we noticed that active notch filters were commonly used in amplifier and audio applications to get rid of 50- and 60-Hz hum interferences. However these networks could be somewhat awkward when it came to tuning the center notch frequency (f0) achieving balance and maintaining consistency.
With the advent of modern high-speed amplifiers we realized it was essential to develop compatible high-speed notch filters that could efficiently handle high-speed notch frequency filtration.
In this exploration we will investigate the possibilities and complexities involved in creating effective high-notch filters.
Circuit for Applying an Adjustable 50 Hz Notch Filter
Hum interference produced by magnetism has a 50Hz frequency, while hum caused by ripple has a frequency of 100Hz. This circuit is capable of managing both types by utilizing a switch that enables either 50Hz or 100Hz operation. The filter consists of two transistor stages with each stage delaying the signal by 90°. At point X the delay peak through Q2 and Q3 is 180°.

Main Characteristics
Before we discuss the topic further, let us outline the vital features necessary for designing the suggested high-speed notch filters.
1) The steep null depth shown in the simulation in figure1 may not be realistically achievable with optimal results typically not exceeding 40 or 50dB.
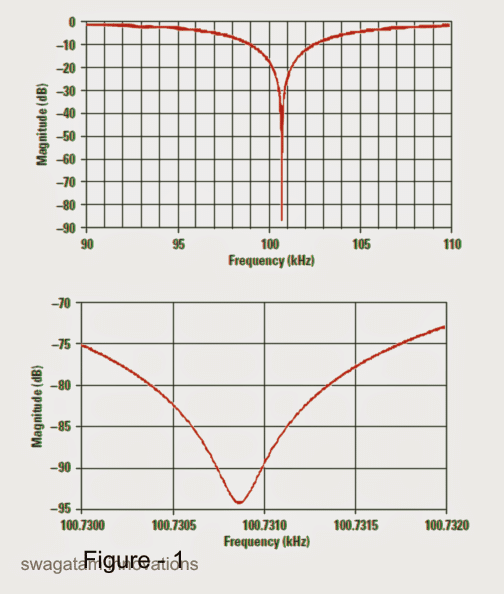
Therefore it is important to recognize that the key elements to enhance are the center frequency and the Q, and the designer should prioritize this over the depth of the notch. The primary focus when creating a notch filter design should be on achieving an optimal level of rejection for the unwanted interfering frequency.
The best way to solve this problem is to carefully choose values for the R and C components using the RC calculator from Reference 1 to determine the optimal R0 and C0 for a specific notch filter design application.
The upcoming information will investigate and aid in comprehending the creation of various intriguing notch filter structures.
Notch Filter with Twin-T Configuration
The figure3 displays a Twin-T filter setup that appears intriguing because of its strong performance and utilization of only one opamp in the layout.
Schematic
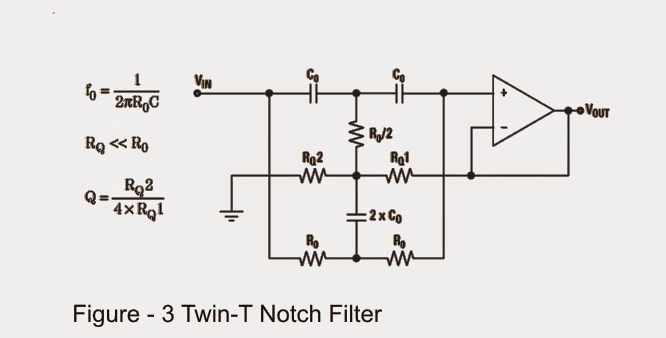
While the aforementioned notch filter circuit works well it may have drawbacks due to its overly simplistic design.
The tuning of the design utilizes 6 precise elements with two of them used to achieve ratios with the rest. To prevent this issue we may need to add 8 more precision components like 2 sets of R0 in parallel and 2 sets of C0 in parallel.
A Twin-T configuration is not compatible with single power sources and is not suitable for complete differential amplification.
The expanding range of resistor values is a result of the requirement for RQ << R0 which could impact the desired center frequency depth.
Despite the challenges mentioned earlier achieving a reasonably effective filtration for the specific application can still be achieved if we manage to optimize the design with high quality precise components.
The Fliege Notch Filter remains unchanged.
The design of the Fliege Notch filter is shown in Figure4 which has several benefits compared to the Twin-T filter as described below
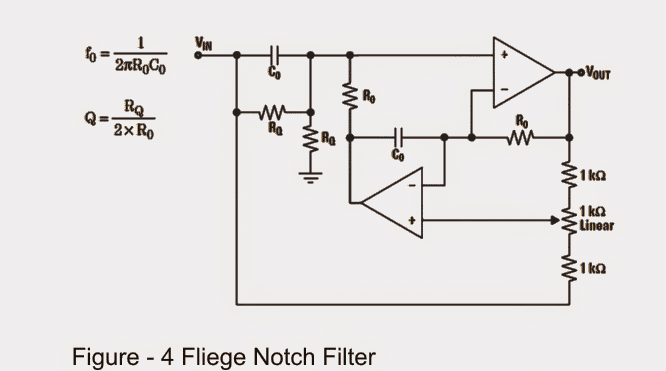
We use only a few precision components such as resistors and capacitors to achieve precise tuning of the center frequency.
One notable feature of our design is that we can tolerate small errors in the components and settings without impacting the depth of the notch point although the center frequency may vary slightly.
We have a few resistors that play a role in setting the center frequency discretely and their values do not need to be extremely precise.
Our setup allows us to adjust the center frequency within a relatively small range without significantly affecting the notch depth.
Nevertheless the downside of our configuration is its reliance on two op-amps which still does not make it compatible with differential amplifiers.
Results from computer simulations
Initially simulations were conducted using the most appropriate opamp models. Shortly after realistic opamp versions were used producing results similar to those found in the laboratory.

Table 1 illustrates the component values we utilized in the schematic shown in Figure 4. We found no practical reason for conducting simulations at or above 10 MHz since our laboratory experiments were primarily done as an initial step with 1 MHz being the key frequency that required the use of a notch filter.
A note on capacitors: While we consider capacitance as just a value used in simulations, actual capacitors are made up of distinct dielectric materials.
The variation in resistor values required us to use a capacitor with a value of 10 nF at 10 kHz. While this worked well in our demonstration switching from an NPO dielectric to an X7R dielectric in the laboratory caused the notch filter to completely lose its functionality.
The 10-nF capacitors we used were pretty similar in specs so the drop in notch depth was mainly because of the lower quality of the dielectric material.
We had to switch back to using a Q value of 10 and a resistance of 3-MΩ for R0.
For practical circuit applications it's best to stick with NPO capacitors. The values listed in Table 1 worked well for both our simulations and lab tests.
At first we ran the simulations without the 1-kΩ potentiometer connecting two 1-kΩ fixed resistors in parallel to the non-inverting input of the lower op-amp.
Check out Figure 5 for the results of our demonstration. You’ll see nine results there but keep an eye out—some waveforms for different Q values might cross over at various frequencies.

Determining the Central Frequency
The middle frequency is slightly higher than the target of 10 kHz, 100 kHz, or 1 MHz in every situation. This is the closest a developer can get using an E96 resistor and an E12 capacitor.
Consider the scenario with a 100 kHz notch.
f = 1 / 2πR0C0
= 1 / 2π x 1.58k x 1nF
= 100.731 kHz
It is evident that the outcome is slightly inaccurate but it can be improved by replacing the 1nF capacitor with a standard E24 value capacitor as shown below.
f = 1 / 2π
x 4.42k x 360 pF
= 100.022 kHz, looks much better
Using E24 capacitors can lead to more accurate center frequencies but getting those E24 series quantities can be pretty pricey and might not be worth it for many labs.
While it sounds good to think about using E24 capacitor values in theory, in reality most of them are not used much and usually take a long time to operate. There are easier options available if you want to buy E24 capacitor values.
If you take a closer look at Figure 5 you will notice that the notch is a bit off from the center frequency. Even at lower Q values there is still a decent reduction in the notch frequency.
If the rejection is not up to par you might want to tweak the notch filter.
Returning once more when looking at the situation at 100 kHz we can see that the response at around 100 kHz is prolonged in Figure6.
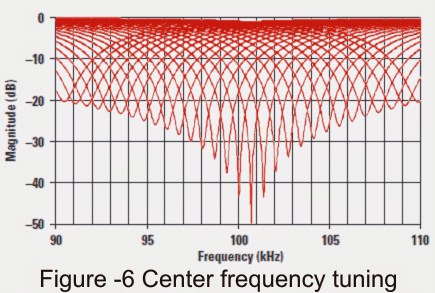
The waveforms on both sides of the central frequency of 100.731 kHz represent our filter responses after we adjusted the 1-kΩ potentiometer in increments of 1%.
Whenever we set the potentiometer to the middle position the notch filter blocks out frequencies that match the exact central frequency.
Our simulated notch reaches approximately 95 dB but we do not expect this to show up in the actual object.
A slight adjustment of 1% on the potentiometer places a peak above 40 dB directly on the desired frequency.
Again using optimal components may give us the best results but our laboratory data shows greater accuracy at lower frequencies of 10 and 100 kHz.
Figure 6 indicates that at the beginning it is essential to reach a frequency closer to the exact one by adjusting R0 and C0. The potentiometers ability to correct frequencies across a wide range may cause a decrease in the notch's depth.
Within a small range of ±1%, a 100:1 rejection of the undesired frequency can be obtained, but within a larger range of ±10%, only a 10:1 rejection is possible.
Results from the laboratory
An evaluation board for THS4032 was utilized to assemble the circuit shown in Figure 4.
It is a versatile framework that only requires 3 jumpers and a trace to complete the circuit.
The values listed in Table 1 were used starting with the ones likely to produce a 1 MHz frequency.
The intention was to search for bandwidth and slew-rate regulations at 1 MHz and examine at different frequencies that were either more economical or higher if necessary.
Findings observed at a frequency of 1 megahertz.
Figure 7 indicates that multiple distinct bandwidth and/or slew-rate responses are achievable at a frequency of 1 MHz. At a Q value of 100 the reaction waveform shows a slight disturbance where a notch could possibly appear.
At a quality factor of 10, there is only a 10-decibel notch while a quality factor of 1 produces a 30-decibel notch.
Notch filters may not achieve as high frequency as expected but the THS4032 is specifically designed for 100-MHz operation.
One can expect better performance from parts with a higher unity-gain bandwidth. Unity-gain stability is extremely important because the Fliege topology has a fixed unity gain.
When trying to determine the exact bandwidth needed for a notch at a specific frequency, the best starting point is to refer to the gain/bandwidth combination in the datasheet, which should be set at one hundred times the notch's center frequency.
Additional bandwidth may be necessary to accommodate higher Q values. As Q is changed the notch center will also exhibit a degree of frequency deviation.
This is identical to the frequency shift observed in bandpass filters.
The decrease in frequency transition is noticeable when notch filters are used to operate at 100 kHz and 10 kHz as shown in Figure 8 and later in Figure 10.
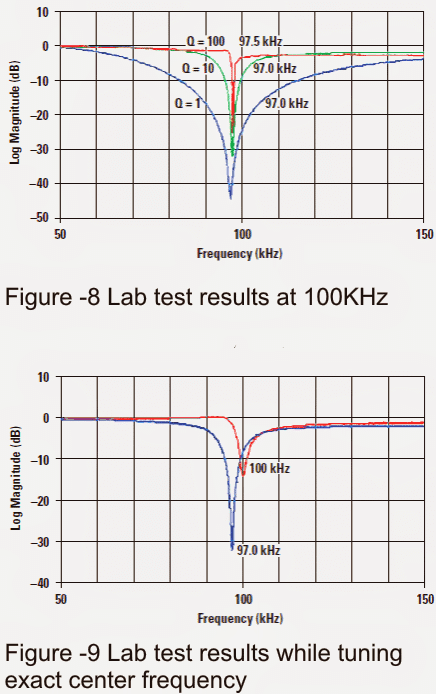
Information recorded at a frequency of 100 kilohertz.
The quantities from Table 1 were then used to create 100-kHz notch filters with different Q values.
The information is shown in Figure 8. It is immediately obvious that functional notch filters are commonly designed with a central frequency of 100 kHz eventhough the depth of the notch is lower at higher Q values.
Remember the goal of the setup mentioned is a 100-kHz notch not a 97-kHz notch.
The preferred part values matched those used in the simulation so the notch center frequency must be precisely 100.731 kHz; however the components in the lab design will determine the actual impact.
The mean capacitance of the 1000-pF capacitor set was 1030 pF and of the 1.58-kΩ resistor set was 1.583 kΩ.
When these values are used to calculate the central frequency it results in 97.14 kHz. However it was very difficult to pinpoint the exact components (due to the board's high level of sensitivity).
If the capacitors are the same, it could be simple to use certain standard E96 resistor values to achieve results closer to 100 kHz.
It is important to mention that in high-volume production using 10% capacitors from various packages and manufacturers may not be a feasible option.
The center frequencies will be determined based on the tolerances of R0 and C0 which is unfavorable if a high Q notch is needed.
Three ways to deal with this situation are:
Procure the resistors and capacitors with greater precision.
Reduce the Q specification and accept a lower level of rejection for the undesired frequency.
Adjust the circuit (that had been considered afterwards).
At this moment the circuit seems tailor-made for accepting a Q of 10 with a 1-kΩ potentiometer incorporated for adjusting the center frequency (as shown in Figure 4).
In a practical circuit design it is advisable to choose a potentiometer value slightly higher than necessary to ensure coverage of the entire range of center frequencies despite potential variations in R0 and C0 tolerances.
This was still not achieved because it was just an illustration of potential capabilities and the lab only had 1 kΩ as the best available quality of potentiometer.
When the circuit was set and fine-tuned to have a center frequency of 100 kHz as shown in Figure 9 the notch level decreased from 32 dB to 14 dB.
Remember that the depth of this notch may be significantly increased by adjusting the initial f0 closer to the most appropriate value.
The potentiometer is meant to be adjusted within a limited range of center frequencies.
Though, a 5:1 rejection of an unwanted frequency is commendable and may be sufficient for various uses. More important projects may definitely require more accurate components.
Limitations in op amp bandwidth can also degrade the magnitude of a tuned notch preventing the notch depth from reaching its minimum possible value. With this in consideration the circuit was once more calibrated to a central frequency of 10 kHz.
Findings at a frequency of 10 kilohertz
Figure 10 shows that the notch valley has increased to 32 dB for a Q of 10 which is expected when the center frequency deviates by 4% from the simulation (Figure 6).

It was clear that the opamp was decreasing the depth of the notch at a frequency of 100 kHz! A 32-dB notch means a reduction of 40 times, which is considered quite good.
Thus despite some components causing a 4% error initially it was simple to create a 32-dB notch exactly at the desired center frequency.
The bad news is that with a 100-MHz opamp, you can only achieve notch frequencies around 10 to 100 kHz due to bandwidth limitations.
In the realm of notch filters, the term "high-speed" is genuinely defined as operating at frequencies in the hundreds of kilohertz range.
A great real-world use for 10-kHz notch filters is in AM (medium-wave) receivers where the signal from nearby stations causes a loud 10-kHz noise in the audio especially at night. This could definitely be annoying when the continuous tuning in occurs.
The audio spectrum of a station is shown in Figure 11 with and without the implementation of the 10-kHz notch. It is important to observe that the 10-kHz noise is the loudest part of the recorded audio (Figure 11a) despite the fact that the human ear is not very sensitive to it.
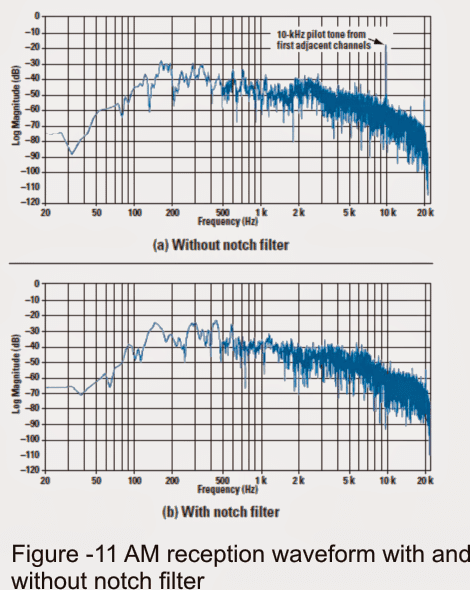
We recorded this audio during the night at a local station that picked up two strong signals from adjacent stations on either side.
It’s important to note that certain variations in the carrier frequencies of these stations are permitted under FCC regulations.
As a result of this allowance we may encounter slight inconsistencies in the carrier frequencies between the two neighboring stations.
These discrepancies can lead to the 10-kHz noises from both stations combining in a way that enhances an unpleasant listening experience for us.
When we utilize the notch filter as shown in Figure 11b, we can effectively reduce the 10-kHz tone to match the same level as the modulation from the neighboring station.
Additionally when we examine the audio spectrum, we can also observe 20-kHz signals emanating from stations that are two channels apart as well as a 16-kHz sound originating from a transatlantic station.
Fortunately these additional signals are usually not a major concern for us as they are significantly diminished by the receiver's intermediate frequency (IF) processing.
It is also worth mentioning that a frequency of approximately 20 kHz is likely inaudible to most people in any given situation.
Leave a Reply